Soaring is Risky Business!
By: Daniel Sazhin and John Bird
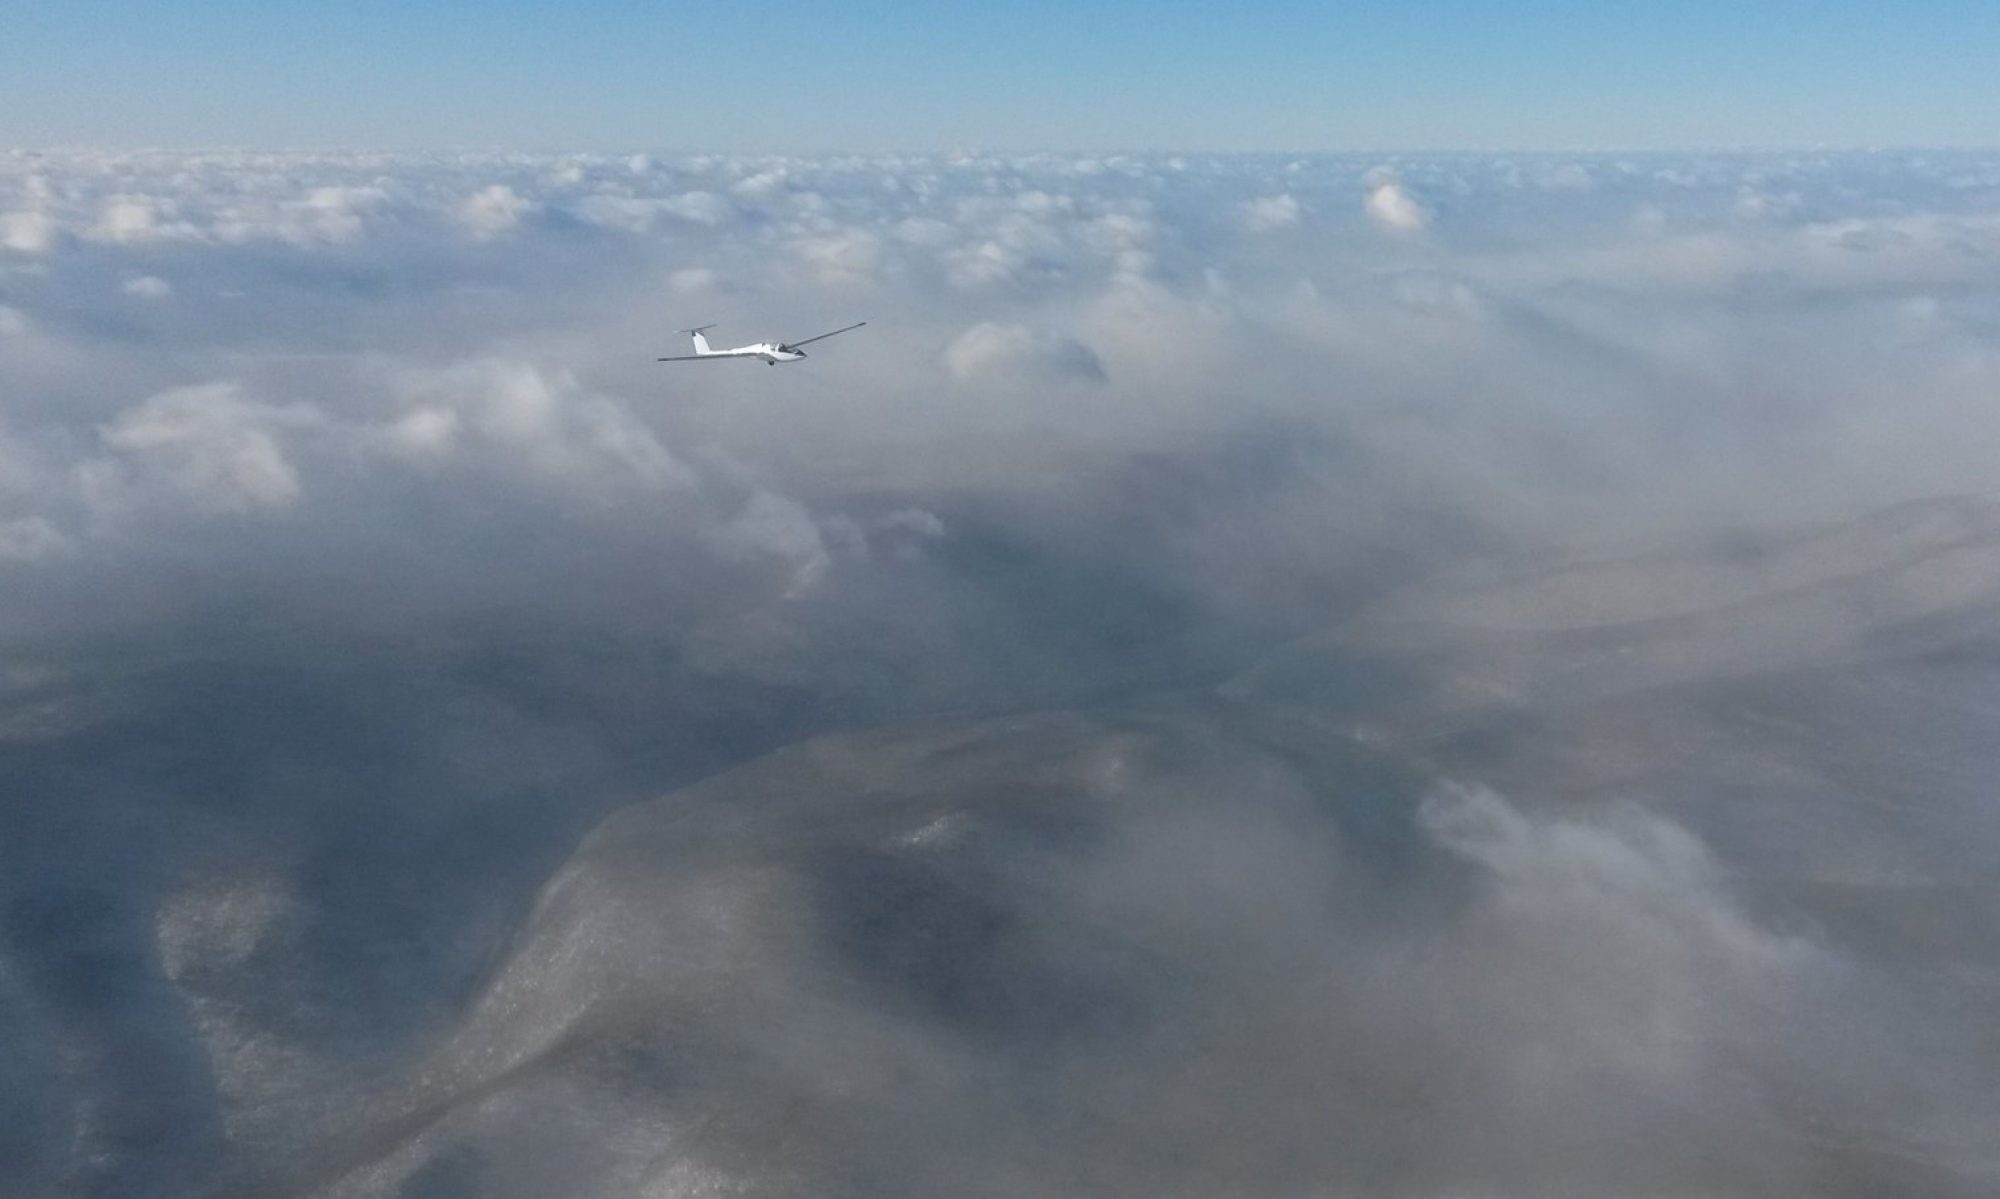
Michael Opitz: It was Day Three of the 1980 Standard Class Nationals at Harris Hill. I was having a good day, having caught up and passed the slow moving gaggle. Now at the top, I started pushing ahead straight on course over the high ground. The sky dried up and went blue, but then I hit a five knot thermal. Climbing up, I figured that the thermals were still working, just dry. I drove further out into the blue hole, only to find completely smooth air. I ended up hitting the dirt, while the gaggle slowly worked its way back home, deviating along the river valleys in order to use the ridges alongside for saves with the headwinds that we had picked up on that leg. That day cost me the competition.
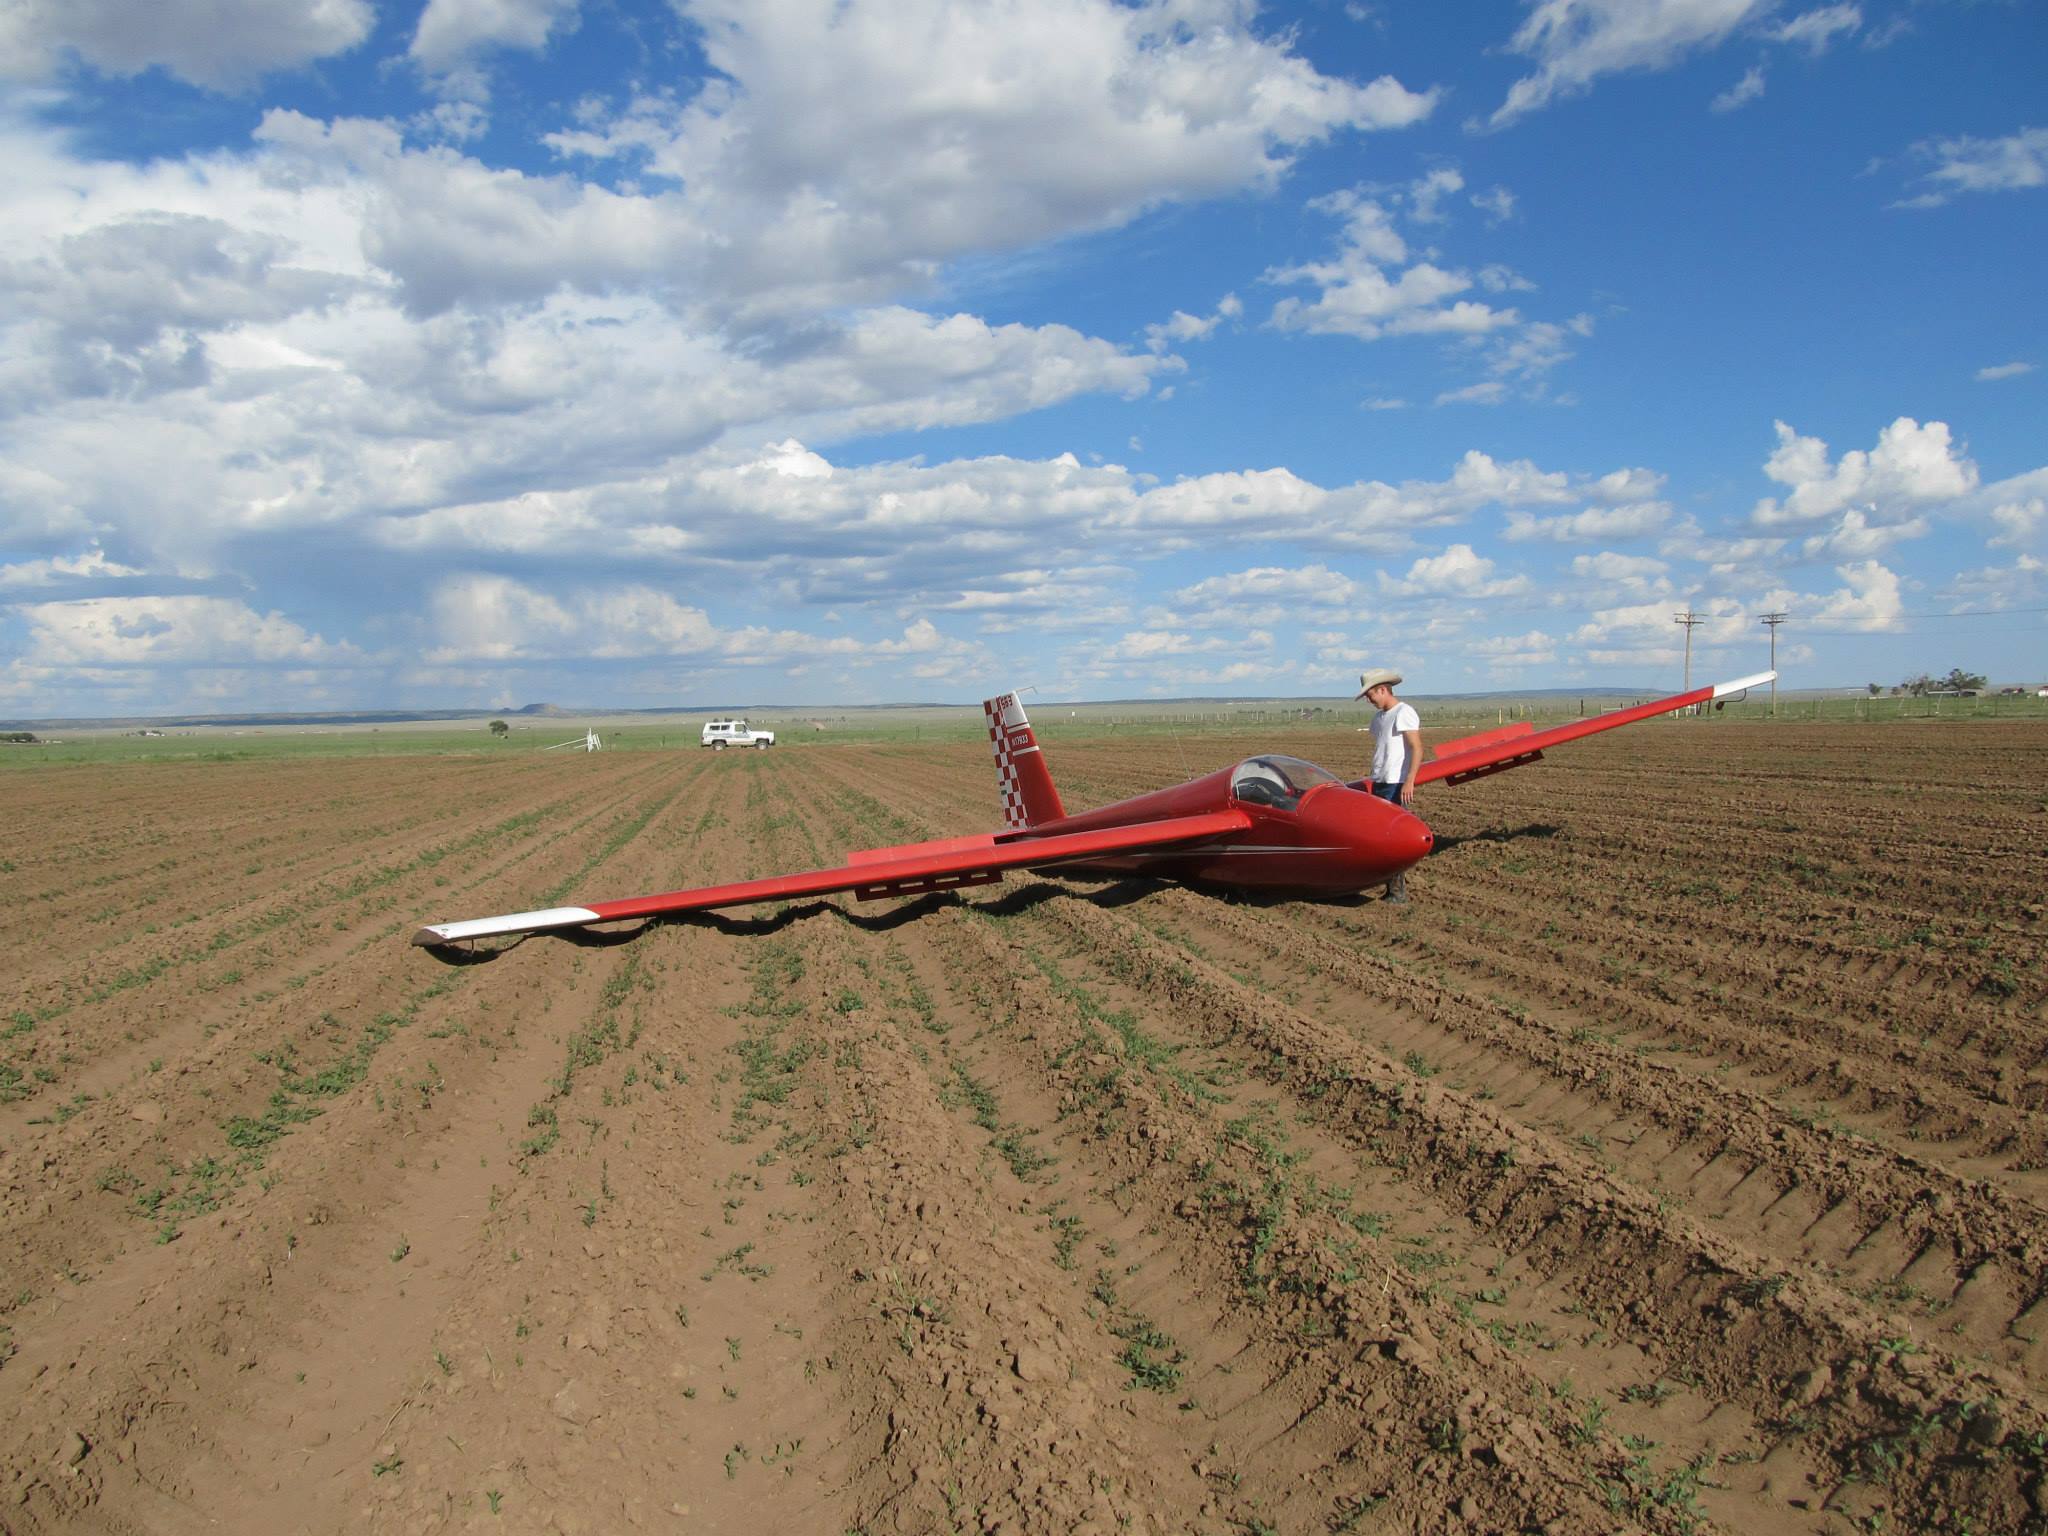
Tony Condon: Gove County, Kansas is a place that I’d had wanted to visit for a while. The Smoky Hill River has eroded millions of years of sediment, exposing the impressive Monument Rocks formation and making the area a destination for fossil hunters. However, landing out in early afternoon on arguably the best soaring day of the year was not what I had in mind for the method of my visit. As I worked out a plan to get home and watched a cumulus filled afternoon sky float by, I started to seriously question my decision making that led to this point. Here I was, a reasonably accomplished cross country pilot, stuck in a field. I had a Diamond Badge on my hat and a National Record hanging on my wall. There were two stints flying on the US Team in my logbook. And yet here I am. Soaring can be a cruel sport sometimes and just when you think you’ve got it all figured out, this sort of reminder comes along. Obviously my risk/reward assessment on this day was incorrect. I had failed to quickly recognize a change in the air ahead, and by the time I downshifted my fate was sealed. It was time to go back to the books…
__________________________
Daniel Sazhin: Many a soaring pilot can relate to these situations. How many times have you been forced on the ground, looking up and wondering what the heck went wrong? The most frustrating aspect is that it is never clear whether the decisions that lead to failure are bad decisions or simply bad luck. The guidance most pilots receive is that it is necessary to “shift gears”. But what does this actually mean? When should you do this? How does gear-shifting actually work? Experienced pilots will say to look out ahead, recognize that the weather is changing and that it is needed to slow down and becomes less selective about thermals. Or conversely, sometimes it is time to “step on the gas” and start flying efficiently. But what classifies this actual change?
After several blown contests and getting rather frustrated at my own failures, I was in Elmira, this time prepping for the Junior Worlds. John Bird, a PhD candidate in aeronautical engineering who specializes in programming UAVs to soar was flying Penn State’s AC-4 in the regional. He was also getting the full Elmira treatment, occasionally blasting along on a cloud street and then digging around in the dirt. And sometimes meeting the farmers.
We got to talking and thinking. We recounted the adages, “If you’re landing out too often, you’re pushing too hard. If you’re rarely landing out, then you’re leaving speed on the table and you can push harder. Learn to switch gears when the conditions change.” But how do you measure these things? And what does gear shifting actually mean?
Not content on waiting many more years to get better at this game, John and I set out to explain and define what risk management in soaring is all about. We formed a very natural collaboration, using my perspectives on decision-making and his experience in modelling and simulations.
Bounded Rationality and Risk Strategy in Thermal Soaring
Daniel Sazhin and John Bird
Having undertaken this project, we did a deep dive in the mathematical properties that drive how risk works in gliding and simulated different risk strategies to see what works best in which conditions. We presented our findings in the 2018 OSTIV Congress in Czech Republic and submitted our paper to Technical Soaring. We encourage the reader to read the paper as it goes into considerably greater detail and depth than we can in this series of Soaring articles. However, for folks who are interested in a simpler version of the reasoning and results, here we present a more condensed version.
The first step to understanding how to manage risk in gliding is to define what “risk” is. For our study, we were only looking at sporting risk, not safety risk. We are concerned with how to soar more efficiently and a flight is assumed to end safely at an airport or a field. As far as sporting risk, this is related to how fast a pilot flies and his likelihood of landing out. Landing out is usually extremely costly, especially in a competition. Even one landout can be disastrous to the pilot’s competitive chances. And even when flying recreationally back home, there’s hardly anyone we know that enjoys landing out often.
Soaring as a Gamble: Dealing with Uncertainty!
To assess the risk of landing out in thermal flying, it’s essential to recognize that soaring involves gambling. On any given glide, we never know for sure if we will hit a thermal or end up in a field. Sometimes soaring pilots must take big sporting gambles, such as when we are in survival mode and are cornered to pick certain thermal sources over others. Other times, when we are high up bombing along a cloud street, we hardly pay attention to the fields below us. Regardless, until the wheel has kissed the ground there’s never a point where the outcome of a soaring flight is truly certain.
Soaring is occasionally compared to chess, but this random element is more akin to poker. Dealing with the uncertainty in soaring requires to think probabilistically — a murky realm where cause and effect aren’t always directly linked. When things go wrong, it isn’t always because you made a bad decision. Sometimes you are unlucky. Even less intuitively, sometimes your successes are not due to your wonderful skills either; sometimes your bad hand works out.
As humans, it’s very challenging to separate luck from skill. We are a species that loves cause and effect; everything must have a reason! Since not all of our readers have formal statistical training, we will occasionally detour to explain the basic statistical ideas that we will draw on in our analysis. Internalizing how probability works is as important as the risk management ideas we offer, so do pay attention!
Independence of Trials
Independence means that the result of one event has no influence on future events. For instance, if you flip a fair coin and it lands on Heads, this has no impact on whether the next coin toss will land once more on Heads or Tails. Even if you land on Tails three times in a row, the likelihood of landing on Heads on the next toss is still 50 percent. To think otherwise would be a case of the “gambler’s fallacy”, which is to think that your luck is bound to change simply because it’s “due”.
We propose that each time a pilot climbs up and initiates a glide, that this is an independent event with a probability of success or failure. Success is finding a thermal; failure is landing out. No matter what, a pilot is always accepting a small risk of landing out; he is in a glider after all!
Multiplication Rule of Probability
The question is, how much risk can we accept on each glide in order to avoid landing out over a competition? Looking at this problem, we must consider both how competitions and risk work in gliding. And as an aside, a recreational pilot could rephrase this question in asking how often they would accept a land out. One in five flights? One in ten? It’s all up to the pilot to decide what their risk preference is.
To go about answering the question, we need to consider how many glides we take and the properties of the risk we routinely accept. Depending on how long you fly on a given day, you will probably take somewhere between 15 to 40 glides. Next, we generally have somewhere between three and seven contest days at a competition. Remembering that each glide is an independent event, we can represent each glide with a certain amount of accepted risk and assess how our consistent choices affect our chances to complete the competition without landing out.
To figure out how the risk that we accept on each glide affects our total risk exposure, we must use the multiplication rule of probability. This says that when you want to find the likelihood of something happening given two events, you have to multiply the probability of both events. Suppose that you want to find the likelihood of flipping Tails twice in a row. Since the probability of flipping Tails once is 50 percent, the likelihood of flipping Tails twice in two trials would be 0.5 * 0.5, equaling 25 percent. Suppose you want to find out the likelihood of flipping tails ten times in a row. You would simply multiply 0.5 by itself ten times, which would be ~P = 0.001. Quite low!
Getting back to gliding, to figure out the likelihood of landing out on a given day, we have to apply the multiplication property to ALL of the glides we take on a given day. By multiplying out the risk we routinely accept, we would then find the likelihood of landing out on a given day and then over the competition.
Suppose you’re flying and on the next glide you estimate that there is only a 1 percent chance of landing out. Sounds pretty good? Now consider what happens if you do this all day long. Bear in mind, you would be taking many glides at this risk level and you only need one to fail to blow the competition. Flying with a risk tolerance of P = 0.01 means each glide has a 99% chance of working, but compounded over 25 glides you would have only a 78 percent chance of completing the task! This may not sound so bad, but what happens when you do this five days in a row? We would need to multiply the probability of landing out each day with each subsequent day! So if you fly for five days, the likelihood of completing the competition without landing out is only 29 percent! And bear in mind, if we increase the number of days, or we increase the number of glides we take per day, this probability gets a lot worse. In a National competition, it isn’t unheard of to take 30 to 40 glides on a given day. In order to keep the likelihood of landing out sufficiently low, we can accept very little risk.

This leads us to a major insight, which is that the risk you accept on a consistent basis has a huge impact on the long run. A pilot who flies at P = 0.01 may do well for a day or two, but is unlikely to make it to the end of the competition without falling out of the band or landing out. This is probably why we have long competitions; pilots who are consistent over the long run will manage to hang in, while others will fail.
Strategic Baseline
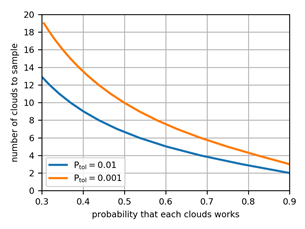
This insight leads us to the concept of the strategic baseline of risk. Looking at the figure, it looks like P = 0.001 is an appropriate amount of risk to take per glide. In a five-day competition, you would have a 90 percent chance of success. As a competitor, you should avoid crossing this risk threshold. Cross it every once in a while, you will probably get away with it. But do it routinely and you will almost assuredly land out over the course of the competition.
Applying This to the Cockpit: Tactical Risk
Supposing that we desire to maintain P = 0.001 as the strategic baseline, what can we do to keep the risk of landing out on a given glide lower than this number? To solve this, we first need to zoom in on what happens on a glide. While we glide along, we sample thermal sources by flying under promising clouds, or over prospective ground features like cities, quarries or power plants. When we sample each of these thermal sources, we will either find or miss the updraft. Since clouds are easier to visualize, we will use clouds as our examples from now on, even though this reasoning can also be used in the blue when picking ground sources to fly over.
For now, let’s consider if the likelihood of finding a thermal under each cloud is like a simple coin toss, where Heads is finding a thermal and Tails is failing to do so. Let’s suppose that we are climbing in a thermal, looking at the clouds ahead. As we get higher, more and more clouds are in range since we can glide further. Since we were quite low when we found this thermal, if we leave immediately, we would have only one other cloud we can get to. This would mean we would have a 50 percent chance of flipping Tails and failing to find a thermal. This is quite a bit higher than P = 0.001! As we climb higher, we now have three clouds ahead. Now we’re going to use that multiplicative property once again and we find that the probability of flipping tails three times in a row and landing out is 12.5 percent, still too high. Working out the math, it takes at least ten clouds in front of us for us to finally cross the P = 0.001 threshold. In this case, if we routinely have less than ten clouds, we would be taking too much risk.
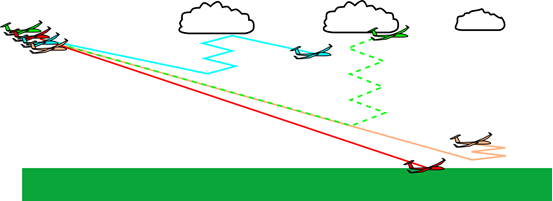
Few of us keep ten clouds in range at all times, yet we rarely descend en masse on unsuspecting pastures and hay fields. This is because finding a thermal under a cloud is not like a simple coin toss. When we fly, we see clouds ahead that are surely “working” and those that are dead or dying. We divert towards the clouds that are more promising. Furthermore, on some days we can estimate that more than half of the clouds are working, and on some days it seems that many of them are liars.
We can adjust for this in our model by using a “weighted” coin. For instance, if we were to estimate that 80 percent of the clouds are working, we can account for this over each cloud we sample with a coin that lands on Heads 80 percent of the time. Doing so reduces the total number of clouds we need, to a more manageable four clouds. Conversely, if fewer than half of the clouds are working we need an unreasonable number of clouds in range and it is almost impossible to maintain the strategic baseline.
The
reliability of lift has a very strong impact on our risk exposure. If the
clouds are reliable, we can have very few clouds in range and still have a very low probability of landing out. If
the clouds are unreliable, it is almost impossible to maintain enough clouds to
have a satisfactory risk exposure. This leads an important observation: When
the reliability of the lift and number of clouds available fall below a
critical threshold, the assumptions which drive MacCready theory and its
variants begin to break down.
While there have been mechanisms suggested that address this problem, such as by John Cochrane in his 1999 paper MacCready Theory in Uncertain Lift and Limited Altitude, these explanations have not incorporated the expected reliability of the lift and its implications on risk strategy. Slowing down and becoming less selective as you get lower are two good mechanisms for minimizing risk, but they indirectly approach this problem. They do so through selectively increasing range and presumably maximizing the number of clouds you will encounter. However, what happens if the reliability of the lift is too low, or if the number of clouds ahead is below the appropriate risk threshold? The optimal strategy may even be to stop and wait until conditions improve. Or, accept a large deviation to clouds off course or fly with other gliders to increase your search area such to get back above this risk threshold. These kinds of decisions are hard to make without assessing your risk exposure directly. Instead, looking at the number of clouds and estimating their reliability provide a more direct way to assess your risk, and it comes more naturally in the cockpit. This helps you identify if the risk is low and you can fly according to MacCready theory, or if the risk is high and staying aloft is more important. We’ll explore these two modes and switching between them more in next month’s installment.
Conclusions
Seeing how strongly reliability affects our risk exposure, we can draw several broad conclusions. If you look ahead and figure that less than half of the clouds are working, you must do your best to minimize your risk exposure. Slow down and maximize the number of clouds available, even if you have to deviate considerably to do so. Be less selective about the lift you are willing to stop for. Fly with other gliders to increase your search area. The game becomes a matter of making it around the course respectably and letting other pilots fall out of the band and/or land out rather than making some brilliant play.
Conversely, if you think most of the clouds are working well, let ‘er rip! Do everything you read in the books and fly fast, take the better thermals and avoid deviating. And if you don’t do this, you’re probably leaving speed and points on the table. But at the same time don’t put all your eggs in one basket either; try to have a couple clouds in front of you consistently as the great coin flip in the sky may still come up Tails. Follow Garret Willat’s adage of never take the last cloud on the cloud street!
When it comes to changing weather conditions, look ahead and ask yourself if the reliability of the lift is changing. If so, then you must change your strategy. And this can happen very quickly. The moment the reliability goes below 50 percent you basically fall off the risk cliff. For instance, this is likely to happen when you enter into a wet blue hole like in Elmira. If you were under clouds before and now are in the blue, it’s probably because there are fewer and weaker thermals in this area. As such, you would be especially prudent to shift your risk strategy to one where your biggest priority is simply to make it home.
We conclude the first part of our risk analysis with several takeaways.
- The risk you routinely accept greatly compounds over the long run. You must consistently maintain a very low risk exposure in order to avoid landing out or falling out of the lift band over the course of a competition. As such, you should stay below the strategic baseline of risk.
- In order to maintain a low risk exposure, you must assess both the number and reliability of the lift available to you. Changes in reliability have a massive effect on your risk exposure.
- Ask yourself if more or less than half of the clouds are working. If less than half, your risk exposure is very high and you must do everything you can to minimize your risk level.
This basic analysis gives us an understanding of how risk works in gliding, and several simple ways to manage it. In our next article, we will delve into the cognitive science of decision-making, define several risk strategies and model them in simulations. While it’s possible to get a lot of mileage out of the simple coin toss model that we presented in this article, we ran more sophisticated simulations, modelling the atmosphere under limited height bands. This allowed us to define and manipulate gear-shifting strategies and analyze how they affect both speed and the risk of landing out. For the adventurous folks who would like to skip and read our paper, you can find it at https://engrxiv.org/yqgkc/.
